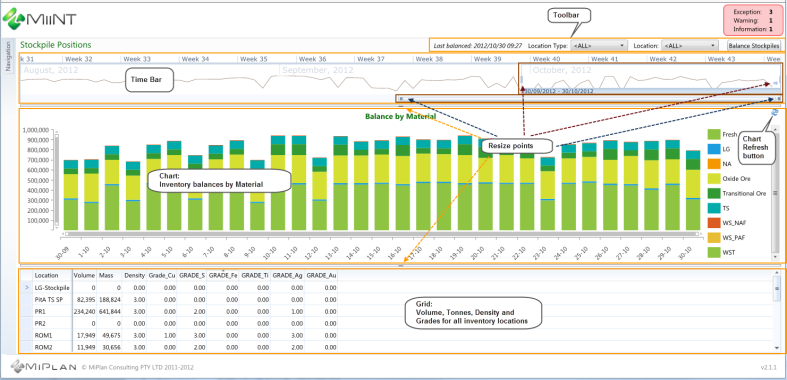
The image below outlines the basic layout of the MiiNT Stock Positions Interface.
The Stock Positions Page Interface contains the following functional areas:
| Functional Areas | Description |
|---|---|
|
Toolbar |
|
|
|
Displays the date and time that the stocks were last balanced. |
|
|
The data presented in the chart and grids can be filtered by the type of stockpile location. Click the drop down arrow and select required location type. |
|
|
The data presented in the chart and grids can be filtered by an individual stockpile location. Click the drop down arrow and select required location. |
|
|
Select the Balance Stockpiles button to manually start the balance stockpiles process. Note: The Balance Stockpiles process can be scheduled to run at selected intervals. |
|
Time Bar |
|
|
|
|
|
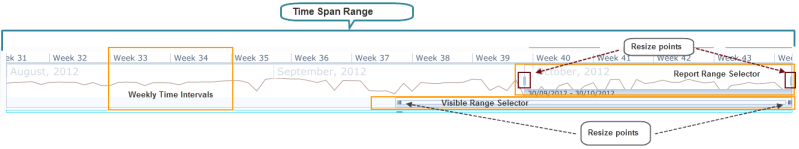
The time bar gives a quick view of the total stocks over time, as well as selecting the date range to be shown in the chart. There are several different ways of selecting the date range to be used to filter the inventory data for the chart and grid:
The default time span range will cover the maximum range of 6 months from the end of the current month. As today is 30/10/2013 the time span range will cover 01/05/2012 to 30/10/2012 in the example above. Note: The Visible Range Selector bar can be used to move along the date time line in either direction and to expand or decrease the time line intervals. As the bar is adjusted the time line interval headings will be displayed as Day, Week or Month in varying formats. |
|
|
|
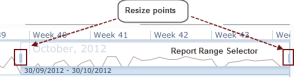
The Report Range Selector can be moved forward and backwards across the days, weeks and months by clicking and dragging the selector to the left or right. It can also be expanded to the left or right by dragging the left or right vertical bars in either direction. The default report range selector time span will be set to start from 30 days prior to today to today. As today is 30/10/2013 the report range selector range will be 30/09/2012 to 30/10/2012 in the example to the left. |
|
|
The Visible Range Selector represents what is currently displayed within the 6 monthly time span range. It can be used to move along the date time line in either direction and to expand or decrease the Daily, Weekly or Monthly time line intervals whilst adjusting their heading formats. The default Visible Range Selector will cover a range of 3 months from the end of the current month. As today is 30/10/2013 the visibility range selector will cover 01/08/2012 to 30/10/2012 in the example to the left. |
|
|
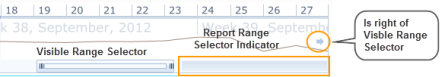
The Report Range Selector Indicator indicates where the currently selected report range is in relation to the Visible Range Selector and whether the selected report range is to the right or left side of the currently visible time span. |
|
|
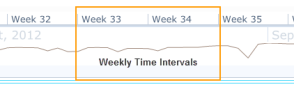
The report range selector can also be set by clicking one of the time line intervals. These could be daily, weekly or monthly. Note: There is a minimum time line interval of 3 days. In the example to the left the time line is displayed in weekly intervals. |
|
Chart |
|
|
|
|
|
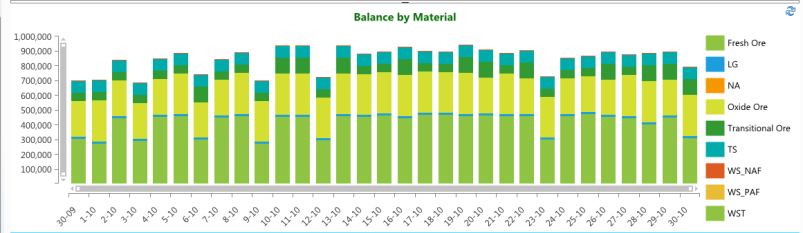
The chart displays the total daily inventory balance volumes by material for the selected report range, as well as providing the exact volume of material for each day when hovering the mouse over the different coloured bars or legends. Different colours are used to represent the materials. Refer to the Charts topic for information on how to view charts. |
|
|
Grid |
|
|
|
|
|
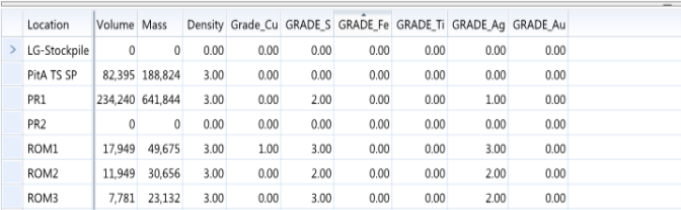
The grid displays the Volume, Density and Grades for all inventory locations for the Report Range Selector end date. Note: The attributes displayed in this grid are determined by the output fields within the query used to generate the data. In the above example the report Range Selector end date is 30/10/2012 . |
|